Monitoring
Message Source Information
Every message that gets copied has a header added called Choria-SR-Source with an example being CHORIA_REGISTRATION 10631 US-EAST-1 PARTITION1 1673433286805.
Using this you can determine where any copied message is from, which worker copied it and the delay between the message creation, and it’s arriving in the target.
From this we know the following:
- The source stream is called
CHORIA_REGISTRATION - The message we are looking at has a Stream Sequence of
10631in the source stream - The replicator name (configured using top level
namein the config file) isUS-EAST-1 - The
nameset on thestreamconfiguration isPARTITION1this allows you to tell which specific copier config copied it, helping to identify ordering or partition logic issues - The message was stored in the source at
1673433286805which is a milliseconds since Unix epoch. Delta between this and the message creation time in the target is how long copy took
Sampling Advisories
Advisories are created for sampled streams as described in Copying Samples of Data. Read on for full detail about those advisories.
Advisories are published to the NATS Server hosting the Source Stream. These advisories could be stored in a Stream and that Stream can also be replicated elsewhere - allowing a large shared real time view of an entire multi location fleet to be build.
When Advisories are published to a Stream one can configure them to be Reliable meaning each message will be tried 10 times on a Backoff policy. Still does not ensure they are 100% reliable but does make them weather short outages.
Advisories should therefor not be the only way you use to calculate expiring nodes but to augment another system giving it an insight it could not otherwise have if it was build using Sampled data.
Advisory Schema
Every advisory message has a protocol key with the value io.choria.sr.v2.age_advisory. This indicates the schema for this message is https://choria.io/schemas/sr/v2/age_advisory.json.
Advisory Details
Each advisory looks like this:
{
  "protocol": "io.choria.sr.v2.age_advisory",
  "event_id": "26QSY17sb9aJL6UPPG6MLOVjIrE",
  "inspect_field": "sender",
  "age": 3600,
  "seen": 1647351430,
  "replicator": "US-EAST",
  "timestamp": 1647355030,
  "event": "timeout",
  "value": "some.host.example.net"
}
| Field | Description |
|---|---|
protocol | Constant indicating the schema |
event_id | A unique correlation ID per event, k-sortable |
inspect_field | The key being inspected in the data that caused the advisory |
age | The time since this sender last checked in, seconds |
seen | Unix time in UTC this sender was last seen |
replicator | A unique indicator of the stream replicator where this advisory originated from. name in the main config section |
timestamp | The time this advisory was generated. Unix timestamp in UTC |
event | The type of advisory. new, timeout, recover or expire |
value | The value found in the sent data that identifies the unique sender |
Inspecting Run-time Data
The stream-replicator command comes with a number of tools to inspect the state and behavior of the system. Most of these
will only make sense when deployed clustered or when data sampling is enabled.
Some of these commands connect to NATS. You need a configuration context that can be created using nats context, this command accept --context or will use the selected context.
To connect to Choria Brokers in Organization Issuer mode pass --choria-jwt and --choria-seed with your Choria tokens.
Searching Advisories
When sampling the Replicator will publish advisories about node states. If you store these in a stream by ingesting choria.registration.advisories.>
you can search for a specific or just view all data:
$ stream-replicator admin advisories REGISTRATION_ADVISORIES node1.example.net --since 5h
Searching 17185 messages for advisories related to node1.example.net

[2023-01-11 12:41:37]     new node1.example.net seen 0s earlier on US_EAST_1
[2023-01-11 12:52:39] timeout node1.example.net seen 11m2s earlier on US_EAST_1
[2023-01-11 12:52:40]  expire node1.example.net seen 11m3s earlier on US_EAST_1
Viewing the state
The above advisories are built by tracking unique values seen in messages, you can view the state store:
$ sudo stream-replicator admin state /var/lib/stream-replicator node1.example.net
/var/lib/stream-replicator/CHORIA_REGISTRATION_US_EAST_1_4.json:

           Value: node1.example.net
       Seen Time: 2023-01-11 12:47:31.714555561 +0000 UTC (18s)
     Copied Time: 2023-01-11 12:47:31.721943055 +0000 UTC (18s)
    Payload Size: 13916
         Advised: false
Viewing cluster sync gossip
When deploying the replicator in a cluster it will sync the state shown above using a gossip protocol, you can observe this in real time:
$ stream-replicator admin gossip
[CHORIA_REGISTRATION.US_EAST_1_4] size: 22272 advised: false: copied: 34m59.985s xx.example.net
[CHORIA_REGISTRATION.US_EAST_1_3] size: 6567 advised: false: copied: 19m59.986s xx.example.net
[CHORIA_REGISTRATION.US_EAST_1_2] size: 6668 advised: false: copied: 29m59.994s xx.example.net
[CHORIA_REGISTRATION.US_EAST_1_2] size: 6748 advised: false: copied: 24m59.992s xx.example.net
[CHORIA_REGISTRATION.US_EAST_1_3] size: 7119 advised: false: copied: 49m59.998s xx.example.net
[CHORIA_REGISTRATION.US_EAST_1_3] size: 6748 advised: false: copied: 24m59.993s xx.example.net
[CHORIA_REGISTRATION.US_EAST_1_3] size: 6785 advised: false: copied: 29m59.989s xx.example.net
End to End latency monitoring
To facilitate monitoring the latency from the point where a message was added to the source stream till it lands in the target one can look at the
Choria-SR-Source header and compare it with the message time in the destination stream.
But what if you have a stream that is not seeing regular traffic? Stream Replicator can publish heartbeats into any subject to cause traffic to be produced thus facilitating continues monitoring, even on otherwise idle streams.
This requires version 0.8.0 of Stream Replicator
Heartbeats can be published to arbitrary subjects by adding the following configuration.
heartbeats:
  interval: 10s
  url: nats://broker.choria.local:4222
  leader_election: false

  # tls:
  #   ca: /path/to/ca.pem
  #   cert: /path/to/cert.pem
  #   key: /path/to/key.pem

  choria:
    seed_file: /etc/stream-replicator/credentials/choria.seed
    jwt_file: /etc/stream-replicator/credentials/choria.jwt
    collective: choria

  headers:
    from: choria_compose

  subjects:
    - subject: choria.node_metadata._monitor
    - subject: example._monitor
      interval: 20s
      headers:
        noop: "true"
Here we enable heartbeats to two subjects, the choria.node_metadata._monitor subject will get messages every 10 seconds
with the from header added.
The example._monitor subject will get messages every 20 seconds and have both the from and noop headers.
The connection will be to a Choria Broker based on the choria configuration, an alternature traditional TLS connection
is shown in addition.
For high availability one can enable leader_election where a specific replicator in a cluster of replicators will be
elected as the one publishing metrics.
The messages being published will have a unix timestamp as body and headers Choria-SR-Originator indicating the host
that published the heartbeat by hostname and Choria-SR-Subject indicating the subject it was published to.
Using nats CLI version 0.0.36 and newer can be used to monitor these messages arrive as planned:
$ nats server check message --stream CHORIA_REGISTRATION --subject choria.node_metadata._monitor --body-timestamp
OK Stream Message OK:Valid message on CHORIA_REGISTRATION > choria.node_metadata._monitor | age=8.0830s size=10B
The command has various flags for monitoring the age, see --help.
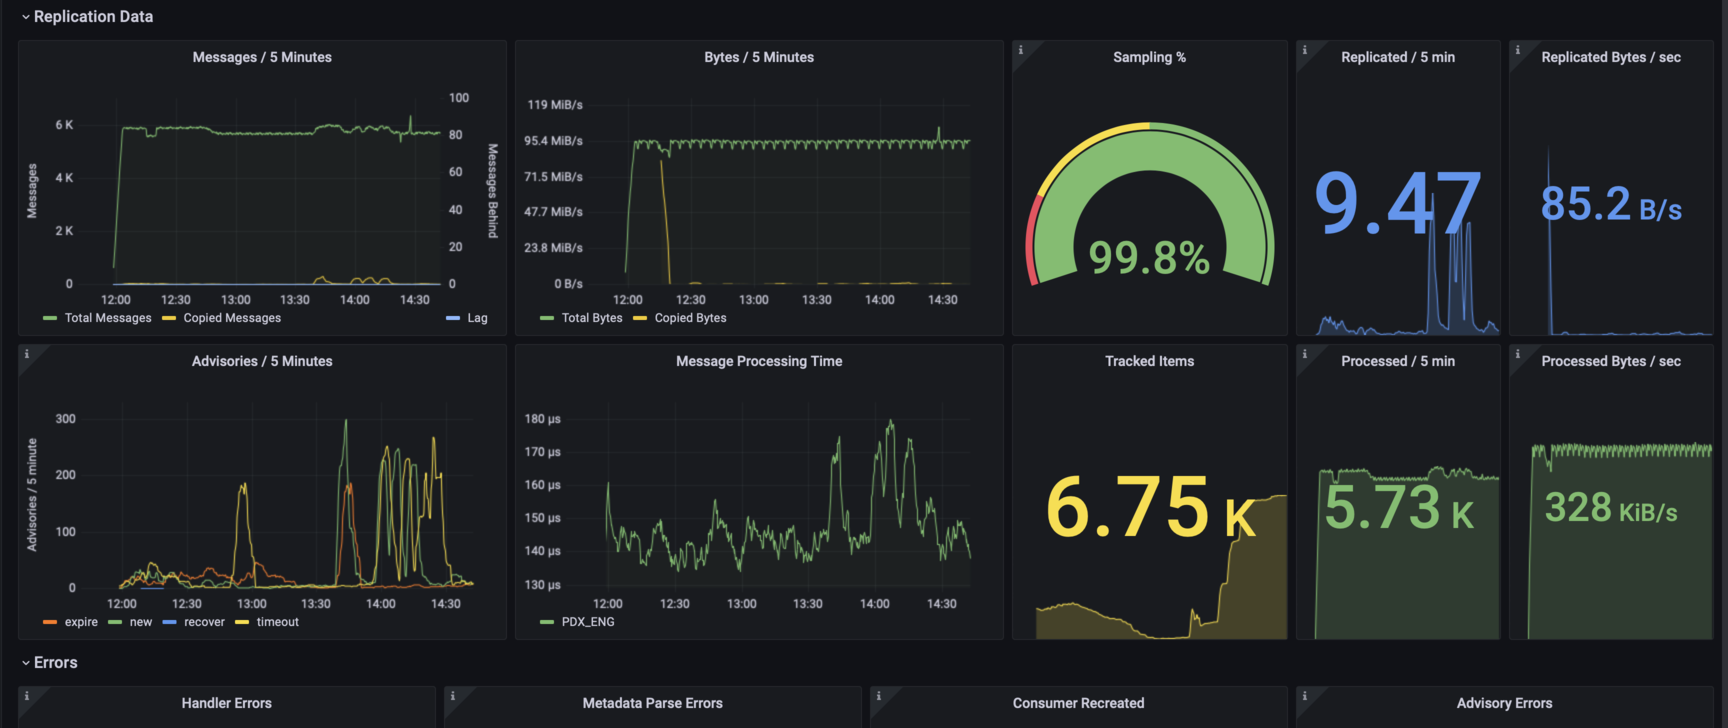
Prometheus Data
We have extensive Prometheus Metrics about the operation of the system allowing you to track message counts, size and efficiency of the Sampling feature.
| Statistic | Descriptions |
|---|---|
choria_stream_replicator_tracker_total_items | Number of entries being tracked for sampling purposes |
choria_stream_replicator_tracker_seen_by_gossip | Number of entries that we learned about via gossip synchronization |
choria_stream_replicator_advisor_publish_errors | The number of times publishing advisories failed |
choria_stream_replicator_advisor_publish_total_messages | The total number of advisories sent |
choria_stream_replicator_limiter_messages_without_limit_field_count | The number of messages that did not have the data field or header used for limiting/sampling |
choria_stream_replicator_limiter_messages_copy_forced_count | The number of messages copied due to inspect_force_field value |
choria_stream_replicator_replicator_total_messages | The total number of messages processed including ones that would be ignored |
choria_stream_replicator_replicator_total_bytess | The size of messages processed including ones that would be ignored |
choria_stream_replicator_replicator_handler_error_count | The number of times the handler failed to process a message |
choria_stream_replicator_replicator_processing_time_seconds | How long it took to process messages |
choria_stream_replicator_replicator_stream_sequence | The stream sequence of the last message received from the consumer |
choria_stream_replicator_replicator_too_old_messages | How many messages were discarded for being too old |
choria_stream_replicator_replicator_copied_messages | How many messages were copied |
choria_stream_replicator_replicator_copied_bytes | The size of messages that were copied |
choria_stream_replicator_replicator_skipped_messages | How many messages were skipped due to limiter configuration |
choria_stream_replicator_replicator_skipped_bytes | The size of messages that were skipped due to limited configuration |
choria_stream_replicator_replicator_meta_parse_failed_count | How many times a message metadata could not be parsed |
choria_stream_replicator_replicator_ack_failed_count | How many times an ack or nack failed |
choria_stream_replicator_replicator_consumer_recreated | How many times the source consumer had to be recreated |
choria_stream_replicator_election_campaigns | The number of campaigns a specific candidate voted in |
choria_stream_replicator_election_leader | Indicates if a specific instance is the current leader |
choria_stream_replicator_election_interval_seconds | The number of seconds between campaigns |
choria_stream_replicator_heartbeat_subjects_count | The number of subjects being published to |
choria_stream_replicator_heartbeat_published_count | The number of messags that was published |
choria_stream_replicator_heartbeat_published_error_count | The number of messags that failed to publish |
choria_stream_replicator_heartbeat_publish_time | Time taken for messages to be published including JetStream ACK time |
choria_stream_replicator_heartbeat_paused | Indicates heartbeat publishing is paused due to leader election |
We have a published Grafana dashboard that you can install in your site, a screenshot of the dashboard is below.