Monitoring
Watching the Provisioning Process
Choria Servers publish lifecycle events, these can be viewed using choria tool event --component provision_mode_server.
Servers will publish startup, shutdown and provisioned events that will be shown in the rolling display. These lifecycle events are published in JSON mode on the network and could be stored in a Stream for analysis.
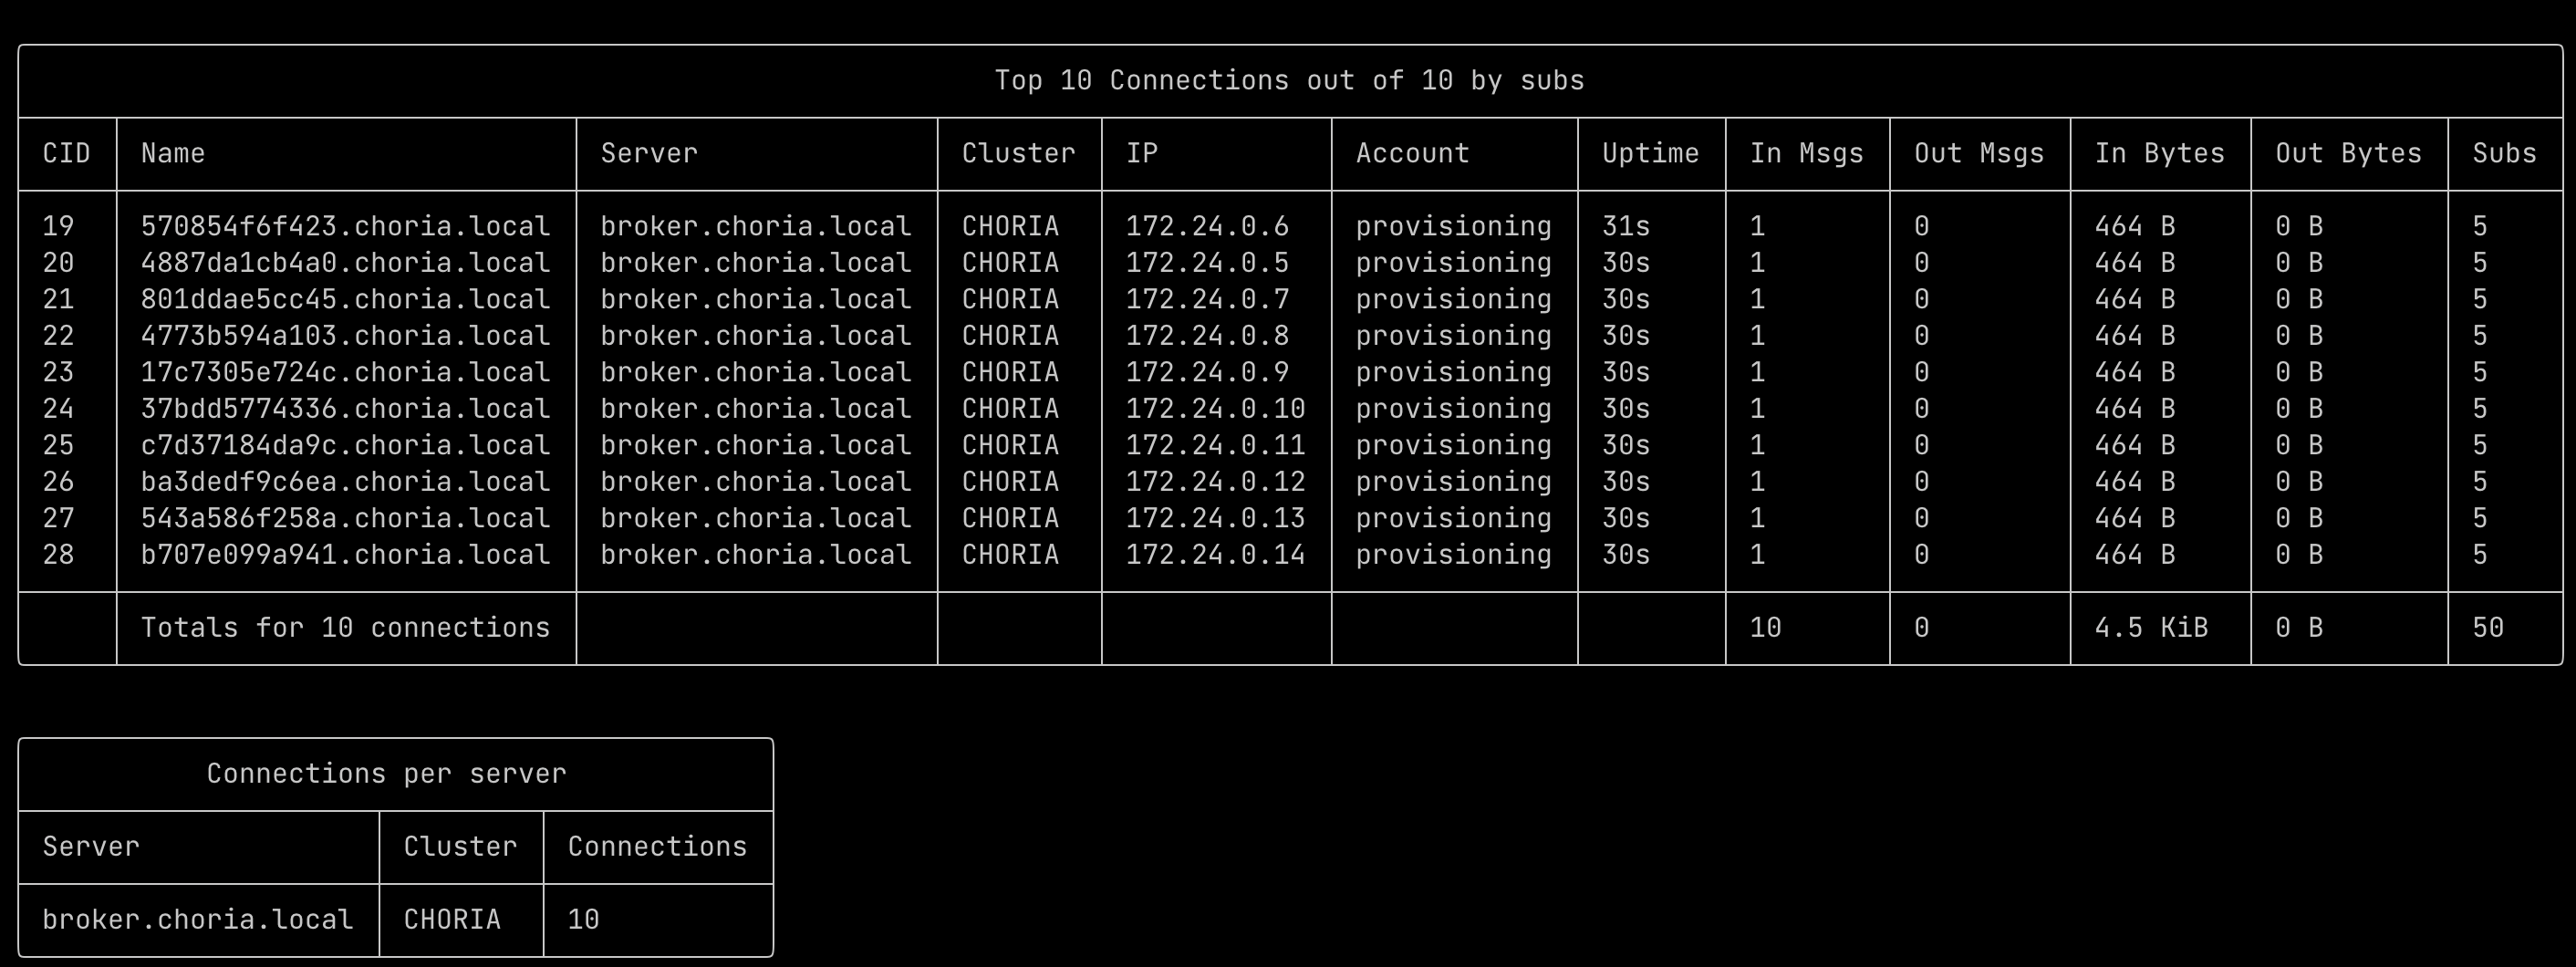
Viewing servers waiting for provisioning
One can view the active connections in the Choria Broker, these are nodes waiting to be provisioned. Typically one would also see connections for the Provisioner in addition to these.
Leader Election
One can determine the node that is currently the leader in the leader election:
A re-election can be forced using choria election evict provisioner.
Prometheus Data
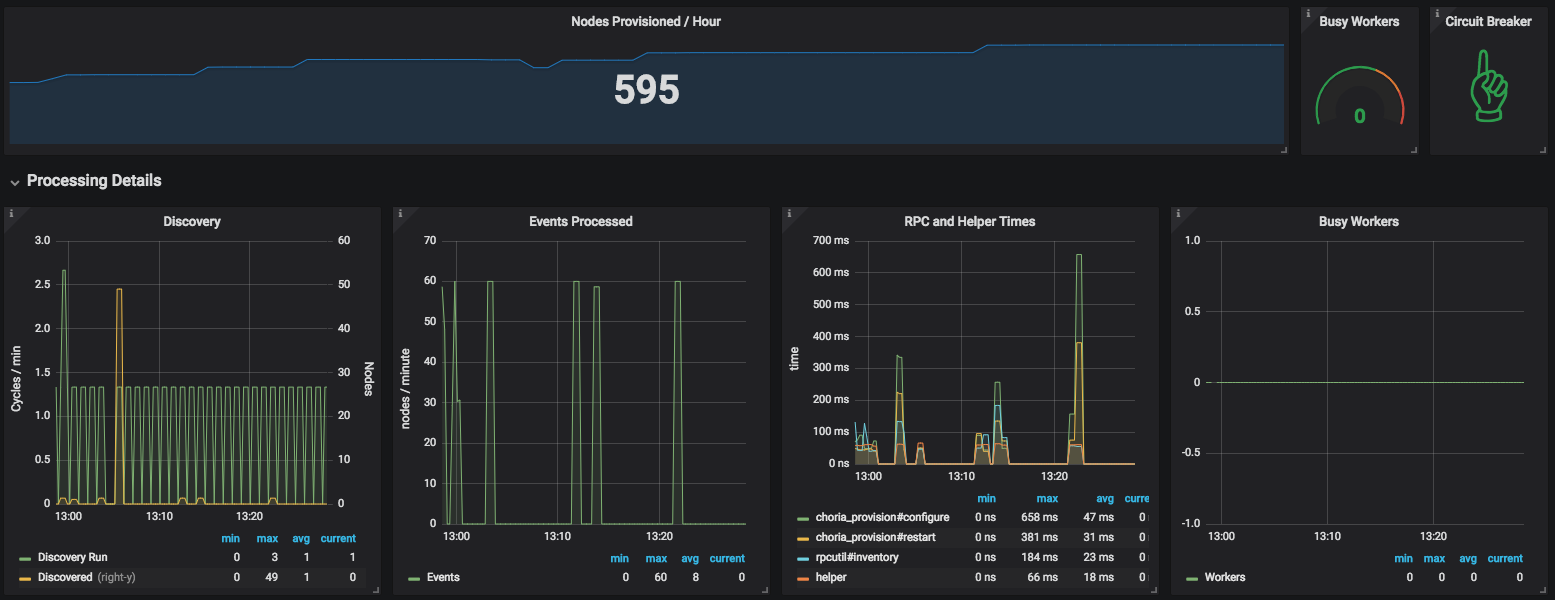
The Provisioner keep statistics in the Prometheus format, using this you can observe deployed counts, performance of individual RPC calls and more.
All the statics have a site label allowing you to easily aggregate a global cluster of AAA Services.
| Statistic | Descriptions |
|---|---|
| choria_provisioner_rpc_time | How long each RPC request takes |
| choria_provisioner_helper_time | How long the helper takes to run |
| choria_provisioner_discovered | How many nodes are discovered using the broadcast discovery |
| choria_provisioner_event_discovered | How many nodes were discovered due to events being fired about them |
| choria_provisioner_discover_cycles | How many discovery cycles were ran |
| choria_provisioner_rpc_errors | How many times a RPC request failed |
| choria_provisioner_helper_errors | How many times the helper failed to run |
| choria_provisioner_helper_shutdown_requests | How many times the helper asked for a node to be shut down and it succeeded |
| choria_provisioner_discovery_errors | How many times the discovery failed to run |
| choria_provisioner_provision_errors | How many times provisioning failed |
| choria_provisioner_paused | 1 when the backplane paused operations, 0 otherwise |
| choria_provisioner_busy_workers | How many workers are busy processing servers |
| choria_provisioner_work_queue_entries | How many nodes are on the work queue waiting to be provisioned |
| choria_provisioner_waiting_nodes | How many nodes are currently waiting to be provisioned |
| choria_provisioner_provisioned | How many nodes were successfully provisioned |
We have a published Grafana Dashboard for this statistics.