Telemetry
Fisk AI exports OpenTelemetry traces and metrics over OTLP/HTTP, following the GenAI semantic conventions. One run is
one trace: how long it took, which model calls it made, which tools it ran, and where the tokens went. It applies to
fisk run, to the runs fisk serve hosts, and to knowledge searches served by fisk mcp. The a2a endpoint, which
serves tools to other agents without running the loop, exports a span per served call and joins the caller’s trace.
Note
Traces and metrics go only to the collector configured below. The Fisk project receives nothing, and export is off by default. Prompts and tool results are not exported unless content capture is turned on.
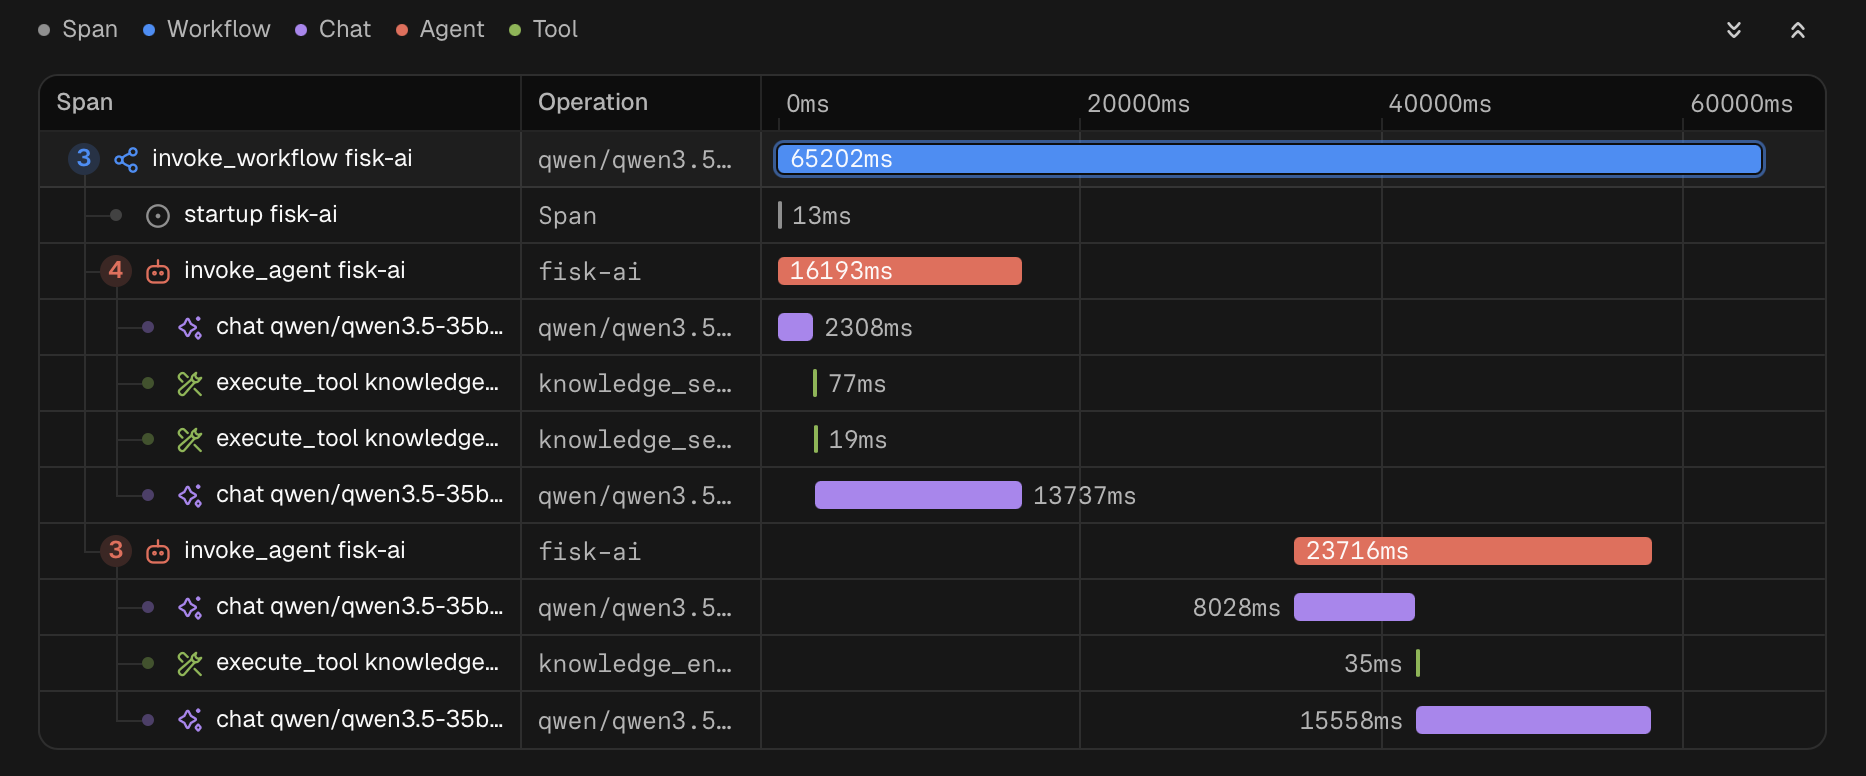
A single session with two prompts:
Turning it on
Add a telemetry block and point it at a collector:
This build speaks OTLP/HTTP, port 4318. Pointing it at 4317 is the OTLP/gRPC port and is rejected at startup.
Every setting is in the reference. Transport credentials are never in the file: the
standard OTEL_EXPORTER_OTLP_HEADERS and friends configure the connection, so the same configuration sends to a
collector, Grafana Tempo, Honeycomb or any OTLP/HTTP endpoint.
--no-telemetry suppresses export: for one run on fisk run, and for the whole process on fisk serve,
which reports whether telemetry is on in its startup banner.
A local collector
Save as otelcol.yaml and run otelcol-contrib --config otelcol.yaml:
Then run the agent. The run’s summary line ends with the trace id, and the full-screen UI shows it on the end card:
With --verbose the run also reports what reached the collector. An export that did not arrive is always reported.
What a trace looks like
A one-shot run:
retrieval covers knowledge_search. knowledge_enumerate gets its own span of that name, since it never ranks and
never uses vectors.
A full-screen run wraps the same work in a workflow, one agent invocation per turn:
A resumed session is a new trace, not a continuation. A trace spans two processes only across an a2a call, where the
request carries the caller’s trace context. Group by gen_ai.conversation.id
to see a session’s whole history. A resumed run’s first chat span continues the iteration numbering, so
fisk.llm.iteration starting at 17 is expected.
Attributes
Standard gen_ai.* attributes carry the model, the token usage, the tool names and the stop reasons. Fisk-specific
ones use a fisk. prefix.
| Attribute | Where | Meaning |
|---|---|---|
fisk.run.terminal_reason | root, turn | completed, max_iterations, error, budget, suspended, setup_failed |
fisk.run.resumed, .crashed, .interactive | root | how the run started and ended |
fisk.run.tool_calls, .remote_tool_calls, .mcp_tool_calls | root | this run’s tool calls |
fisk.llm.uncached_input_tokens | root, turn, chat | input tokens billed at the uncached rate |
fisk.llm.thinking, .prompt_cache, .tool_search | root | the feature switches this run used |
fisk.llm.iteration, .messages, .tools | chat | loop index and the sizes sent |
fisk.session.end_id | root | the session the run ended on, when /clear rotated it |
fisk.session.usage.*, .llm_calls | root | session totals including the resumed prefix, resumed runs only |
fisk.turn.index | turn | one-based turn number |
fisk.tool.kind | execute_tool | which provider supplied the tool |
fisk.tool.outcome | execute_tool | executed, error, unknown_tool, capacity, policy_denied, missing_arguments, confirm_denied, confirm_unanswered, deferred |
fisk.tool.arg_keys | execute_tool | the argument key names, never their values |
fisk.tool.requested_name | execute_tool | the name the model asked for, unknown tools only |
fisk.tool.confirm_wait_ms | execute_tool | how long the call waited on the operator |
fisk.tool.remote, .remote_agent, .rewritten, .resumed | execute_tool | how the call was dispatched |
fisk.tool.exit_code | execute_tool | the exit status of the command the tool ran, absent when it ran none |
fisk.tools.application, .builtin, .remote, .custom, .deferred | startup | the resolved tool inventory |
fisk.remote_hosts | startup | configured remote tool hosts |
fisk.memory.backend, .location | startup, memory_index, execute_tool | the memory store this run used |
fisk.memory.entries | memory_index | memories the start-of-run listing returned, absent when it failed |
fisk.knowledge.tier.configured | retrieval | hybrid or lexical, as configured |
fisk.knowledge.tier.effective | retrieval | the tier that ran, absent when neither retriever did |
fisk.knowledge.top_k | retrieval | the effective result ceiling, after defaulting and clamping |
fisk.knowledge.search.status | retrieval | ok, index_not_built, index_empty |
fisk.knowledge.sections | retrieval | sections returned |
fisk.knowledge.indexed_chunks | retrieval | corpus size, absent when there is no index |
fisk.knowledge.degraded, .degraded_reason | retrieval | the fallback to lexical and why |
fisk.knowledge.enumerate.status | knowledge_enumerate | ok, index_not_built, corpus_empty, query_empty |
fisk.knowledge.matched, .documents, .truncated | knowledge_enumerate | the matched set, what was returned, and whether they differ |
fisk.knowledge.limit, .min_body_matches | knowledge_enumerate | the options that shaped those counts |
fisk.knowledge.indexed_documents | knowledge_enumerate | corpus size, absent when there is no index |
fisk.embeddings.inputs | embeddings | texts in this request |
fisk.embeddings.purpose | embeddings | query or dimension_probe |
Group tool calls by fisk.tool.outcome: a policy denial, an unknown tool and a failed command all return an error to
the model, and only this tells them apart.
A run with content capture on carries the gen_ai.* content attributes and fisk.content.*
alongside these.
On execute_tool, fisk.memory.backend and .location are present on memory tool calls only, so filtering on them
selects the calls that reached the store. They describe the tool that ran, which a PreToolUse hook can change, and
they are span attributes rather than metric labels: on the tool duration histogram the backend would be empty for
every tool that is not a memory tool. They stay on startup as well, which is where a run that binds a store but
never calls a memory tool reports it.
Model call attempts
One chat span can be several HTTP requests: the Anthropic SDK retries a rate limit or a transport failure inside the
call. The span covers the whole call, and each attempt is recorded as an event on it.
| Event | When |
|---|---|
fisk.llm.http_response | an attempt got a response, whatever the status |
fisk.llm.http_error | an attempt got no response at all |
| Attribute | Where | Meaning |
|---|---|---|
fisk.llm.http_attempt | both events | one-based attempt number within this model call |
fisk.llm.http_duration_ms | both events | how long the attempt took |
http.response.status_code | fisk.llm.http_response | the status the attempt received |
error.type | fisk.llm.http_error | the failure class, provider unless the run was canceled or timed out |
http.request.resend_count | the chat span | retries after the first attempt, absent when there were none |
A call that took ten seconds with http.request.resend_count of 3 spent most of it waiting on retries, not on the
model. The status code is on the events rather than the span because a span attribute would be last-attempt-wins and
report 200 for a call that spent most of its time being rate limited.
Nothing about the request or the response body is recorded: not the URL, which can carry credentials in its userinfo, not the headers, and not the response body or the error text. An attempt is a status code, a duration and an ordinal.
Remote agents
A tool served by another agent gets an invoke_agent <remote> span inside the execute_tool span that dispatched it.
It covers the a2a call.
| Attribute | Meaning |
|---|---|
gen_ai.operation.name | invoke_agent |
fisk.tool.remote_agent | the agent the call was sent to |
gen_ai.tool.name | the tool named on the wire |
error.type | how the call ended, absent on success |
error.type separates the failures that look alike from the model’s side:
| Value | Meaning |
|---|---|
remote_unavailable | no agent answered, or the deadline passed first |
remote_capacity | the agent answered and refused: it is at its concurrency limit and ran nothing |
tool_error | the call was answered and the tool failed on the far side |
canceled, timeout | this run stopped, not the peer |
other | anything else |
The request carries this span’s trace context, so a peer running Fisk AI puts its own span for the call in this trace and a slow remote call shows where the time went. A peer that exports nothing, or one that is not Fisk AI, still shows only as a slow span here.
The two sides can still disagree about when the call ended. A served call reports that it is running every ten seconds,
so a caller gives up only when those stop or when harness.tool_timeout ends the whole call, and a span closed as
remote_unavailable under a server span that is still open means the caller stopped hearing from a peer that kept
working.
Knowledge
fisk.knowledge.tier.configured and .tier.effective differing means the vector tier was configured and did not run.
fisk.knowledge.degraded_reason says why, from a fixed set: embeddings and timeout are the embeddings server,
index_meta is the index’s own metadata failing to read, canceled is the run stopping. Only index_meta is a
problem with the store rather than the server, and it is the one case that opens no embeddings child span.
fisk.knowledge.sections counts sections and fisk.knowledge.documents counts documents; several sections routinely
come from one file, so the two are not comparable.
The embeddings span carries server.address, server.port and, when a response arrived,
http.response.status_code. The dimension probe is lazy and cached per process, so the first search of a run makes two
embeddings requests; fisk.embeddings.purpose tells them apart. A server that cannot be reached never lets the probe
cache, so every later search makes a probe request and no query request.
retrieval and embeddings do not add up to the execute_tool span above them: the tool renders its tier banner and
trims results to the injection budget after the store has returned.
Indexing is not instrumented. fisk knowledge index and fisk knowledge watch start no telemetry, so the knowledge
spans are constructed and discarded there.
fisk mcp does export them. A knowledge_search that arrived over MCP opens the same retrieval and embeddings
spans an agent run does, and each is its own trace with retrieval at the root: there is no run above it. Everything
else fisk mcp serves is uninstrumented, so a config that exposes no knowledge tools exports nothing.
Metrics
| Metric | Attributes |
|---|---|
gen_ai.client.token.usage | operation, provider, model, gen_ai.token.type |
gen_ai.client.operation.duration | operation, provider, model, error.type |
gen_ai.invoke_agent.duration | agent name, terminal reason, interactive |
gen_ai.invoke_agent.inference_calls | as above |
gen_ai.invoke_agent.tool_calls | as above |
gen_ai.execute_tool.duration | tool name, kind, outcome, error.type |
fisk.knowledge.degraded_searches | fisk.knowledge.degraded_reason |
fisk.session.append.duration | fisk.session.backend, error.type |
gen_ai.invoke_agent.* is recorded per turn, treating a one-shot run as one turn.
fisk.session.append.duration times each write to the run journal, and is recorded only for a checkpointed run. It is
a metric rather than a span because a run appends once per record, so a span each would outnumber every other span in
the trace. The file backend writes locally and sits in the lowest buckets; the jetstream backend makes a network
round trip per append, and this metric shows that difference. A failed append is recorded with its error.type, so the
time spent before a failure is visible rather than missing.
fisk.knowledge.degraded_searches counts searches that fell back to lexical. It is a metric rather than a span
attribute alone because spans are sampled: with sample_ratio below 1.0 most degraded searches never reach the
backend, and an embeddings outage silently costs every search its vector tier. There is no knowledge duration metric;
gen_ai.execute_tool.duration filtered on gen_ai.tool.name covers it.
gen_ai.token.type carries only input and output, so the histogram can be summed without grouping. Set
no_metrics: true to export traces alone.
Working out cost
gen_ai.usage.input_tokens includes cached tokens, and cache reads bill at roughly a tenth of the uncached rate. So:
fisk.llm.uncached_input_tokens is that first term already worked out, and is the same number the run summary prints.
gen_ai.usage.reasoning.output_tokens is the share of output_tokens the model spent reasoning. It is already
included in output_tokens, so it does not enter the calculation above; it is there because reasoning is not
displayed by default, which makes a dashboard the only place its cost is visible.
On a resumed run, gen_ai.usage.* on the root covers that process alone, so summing it across a session’s traces
gives the session total once. fisk.session.usage.* carries the cumulative view for comparison. The three
fisk.run.*tool_calls counters work the same way: each covers that process alone, and the remote and MCP counts
are subsets of fisk.run.tool_calls on every run, resumed or not.
Privacy
By default spans carry structure and timing: no prompt, tool argument value or tool result is exported, and error
messages are reduced to a fixed error.type class rather than their text.
Content capture changes that. With it on, the system prompt, the conversation, the model’s replies, tool arguments and tool results are exported as span attributes. It is off unless the config turns it on.
The OpenTelemetry credential variables are stripped from tool subprocess environments whether or not telemetry is
enabled, so --no-telemetry does not re-expose a collector token. See the reference
Safety section for the full list and its limits.
Content capture
Off by default. With it on, a trace carries the conversation itself:
Everything the model saw is exported
Whoever can read the traces can read the conversation, and an export cannot be recalled. Tool results are the
verbatim output of whatever command the model ran, and the system prompt includes the memory index. Content capture
bypasses the error.type reduction and every other limit described above. Use it for a short investigation against
a collector you control, not as a fleet default.
harness.pii is the one thing that reaches this: it scans the prompt and each tool result before the conversation
is built, so what it removed was never exported. It does not scan the system prompt or the memory index in it, and
its detection is best-effort, so treat what arrives as unredacted.
A run with capture on shows OTEL Enabled + content on the full-screen startup card and marks its summary line:
fisk info shows what would be captured, including the derived export batch size. Plain http:// to a non-loopback
host is rejected at startup while capture is on.
There is no command-line flag: capture is a config setting. --no-telemetry suppresses it along with the rest of the
export.
The content attributes
| Attribute | Where |
|---|---|
gen_ai.system_instructions | startup, once per run |
gen_ai.input.messages | chat |
gen_ai.output.messages | chat |
gen_ai.tool.call.arguments | execute_tool |
gen_ai.tool.call.result | execute_tool |
fisk.content.from_index | chat, where this call’s messages start |
fisk.content.truncated | the attributes on this span that were cut |
fisk.content.dropped_messages | messages dropped to fit |
Each is a JSON document in the shape the GenAI conventions define.
Never exported: a thinking block’s provider signature, and the payload of a provider-specific block such as a server-side tool search result. Reasoning text is exported.
A denied tool call still exports its arguments. The system prompt is on startup rather than on each model call
because it does not change during a run.
Why gen_ai.input.messages holds only one message
messages: delta, the default, exports only what each model call added to the conversation, so no single span holds
the whole thing. fisk.content.from_index says where a span’s messages start; add it to the number of messages
exported and you get fisk.llm.messages on the same span. Consecutive model calls chain, so a gap means a span did
not arrive.
Set capture.messages: full to put the whole conversation on every model call. That is quadratic in the length of
the conversation: a thirty-iteration run exports thirty copies of a growing transcript.
Some content reaches no message attribute at all. A run that ends at the iteration cap, on the token budget, or on a
hook abort leaves its last tool results with no model call after them; those survive as gen_ai.tool.call.result on
the tool spans. Do not sum message attributes across the traces of one session either: a resumed run’s first model
call carries the whole restored conversation.
Sizing
Each attribute is capped at capture.max_bytes (256 to 65536, default 8192), measured on the encoded JSON. Over the
cap, whole messages are dropped oldest-first and then text is shortened, so the document always parses;
fisk.content.truncated and fisk.content.dropped_messages say what happened.
OTEL_SPAN_ATTRIBUTE_VALUE_LENGTH_LIMIT lowers the cap to match rather than being overridden, so the SDK never cuts
a document mid-structure.
Capture raises the size of every export, so the batch size is reduced and gzip is turned on. A collector may still need its receive limit raised:
With sample_ratio below 1.0, content is exported only for sampled traces.
When it does not look right
| What you see | What it means |
|---|---|
a value ends in [truncated by fisk-ai: ...] | it hit capture.max_bytes; the marker names the original size |
a value is cut off and the span has no fisk.content.truncated | your collector or backend cut it, not Fisk AI |
gen_ai.input.messages holds one message | the delta; see above |
| no traces, and an export warning after the run | the batch was refused, usually on size with capture on |
| spans missing from a trace, and no warning at all | the span queue overflowed; the delivery line cannot see this |
The other run outputs
| Output | Scope | Contents | Use when |
|---|---|---|---|
--trace FILE | one run, local | exact request and response bodies, including retries | debugging Fisk AI or the provider |
--http-debug | one run, local | raw bodies to a fixed file, a subset of --trace | prefer --trace |
| run summary | one run, local | counters and latency | the receipt for the run that just finished |
| telemetry | many runs, many processes | structure and timing; the conversation only with capture on | which tool fails, where time goes, across a fleet |