Monitoring
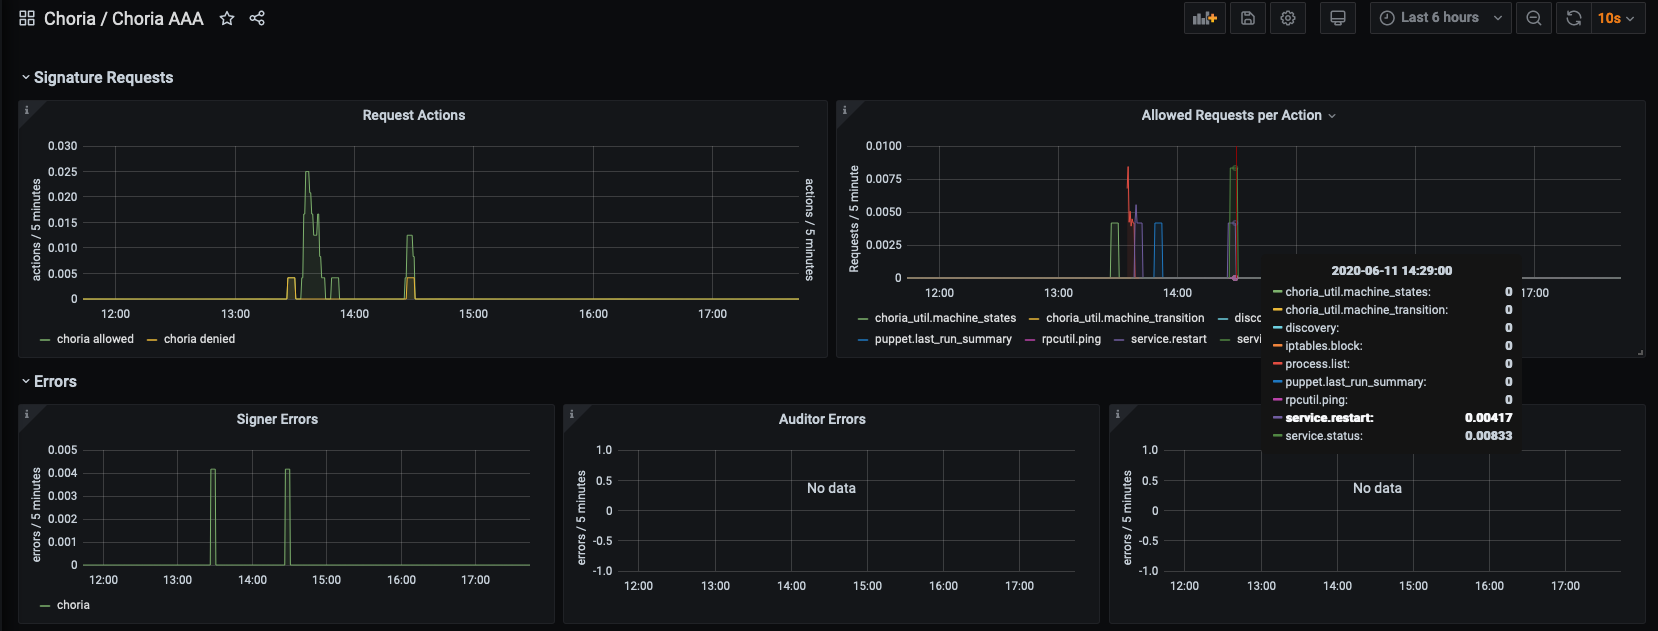
The AAA Service keep statistics in the Prometheus format, using this you can see graphs of allow/denies but also get granular statistics for every Agent and Action.
All the statics have a site label allowing you to easily aggregate a global cluster of AAA Services.
| Statistic | Description |
|---|---|
choria_aaa_auditor_errors | Total number of audit requests that failed |
choria_aaa_authenticator_errors | Total number of authentication requests that failed |
choria_aaa_authenticator_time | Time taken to handle logins |
choria_aaa_authorizer_allowed | Total number of requests that were allowed |
choria_aaa_authorizer_denied | Total number of requests that were denied |
choria_aaa_authorizer_errors | Total number of requests could not be authorized |
choria_aaa_signer_errors | Total number of requests that could not be signed |
choria_aaa_signer_allowed | Total number of requests that were allowed by the authorizer |
choria_aaa_signer_denied | Total number of requests that were denied by the authorizer |
choria_aaa_signer_invalid_token | Total number of requests that contained invalid tokens |
choria_aaa_build_info | Build information about the running instance |
We have a published Grafana Dashboard for this statistics.